Market Outlook
November 13, 2017
Market Cues
Domestic Indices
Chg (%)
(Pts)
(Close)
Indian markets are likely to open flat tracking global indices and SGX Nifty.
BSE Sensex
0.2
64
33,315
Nifty
0.1
13
10,322
U.S. stocks finished the week on a subdued note, as worries over U.S. tax reform
and a delay of the promises cut in corporate taxation, weighed on investors' minds.
Mid Cap
(0.1)
(15)
16,563
However, some strong corporate results limited the day’s decline and kept the
Small Cap
0.1
12
17,644
NASDAQ in barely positive territory. The Dow DJIA fell 0.2%, to close at 23,422.
Bankex
1.0
286
28,921
The S&P 500 SPX, ended down 0.1% to 2,582.The NASDAQ rose 0.1% to finish at
6,751.
Global Indices
Chg (%)
(Pts)
(Close)
U.K. stocks dropped Friday, with retailers and energy producers among those that
Dow Jones
(0.2)
(40)
23,422
lost ground, sending the London gauge of blue-chip stocks to its lowest close since
Nasdaq
0.0
1
6,751
late September. The FTSE 100 index UKX, slumped 0.7% to closed at 7,433.
FTSE
(0.7)
(51)
7,433
Nikkei
(0.7)
(168)
22,513
On domestic front, shares ended a choppy session slightly higher on Friday after the
GST Council pruned tax rates on many regular consumption products. After
Hang Seng
0.2
65
29,186
reporting strong Q2FY18 numbers SBI led the gainers in the Nifty pack to end up by
Shanghai Com
0.2
8
3,441
more than 6%. Larsen & Toubro also jumped 4.6% as company able to bagged
order worth of `4023cr across business segments. The benchmark BSE Sensex
Advances / Declines
BSE
NSE
ended higher 0.19% at 33,315.The broader Nifty index closed up 0.12% to finfish at
Advances
1,167
711
10,322.
Declines
1,532
998
News Analysis
Unchanged
159
69
Axis Bank To Raise `11,625cr From Bain Capital, Others
Detailed analysis on Pg2
Volumes (` Cr)
BSE
4,964
Investor’s Ready Reckoner
NSE
35,743
Key Domestic & Global Indicators
Stock Watch: Latest investment recommendations on 150+ stocks
Net Inflows (` Cr)
Net
Mtd
Ytd
Refer Pg5 onwards
FII
(667)
9,765
48,218
Top Picks
MFs
(1,360)
(1,535)
93,876
CMP
Target
Upside
Company
Sector
Rating
(`)
(`)
(%)
Blue Star
Capital Goods
Buy
696
867
24.6
Top Gainers
Price (`)
Chg (%)
Dewan Housing Finance
Financials
Accumulate
638
712
11.5
Redington
205
11.4
Asian Granito
Other
Buy
491
570
16.2
Justdial
500
9.0
Navkar Corporation
Other
Buy
188
265
40.7
Gdl
257
8.7
KEI Industries
Capital Goods Accumulate
341
380
11.6
Rtnpower
7
8.4
More Top Picks on Pg4
Pfizer
1,905
8.4
Key Upcoming Events
Previous
Consensus
Date
Region
Event Description
Reading
Expectations
Top Losers
Price (`)
Chg (%)
Nov13
India
Exports YoY%
25.67
Jisljaleqs
96
(7.8)
Nov13
India
Imports YoY%
18.09
Rcom
14
(6.3)
Nov14
Euro Zone Euro-Zone GDP s.a. (QoQ)
0.60
0.60
Auropharma
740
(6.2)
Nov14
India
Monthly Wholesale Prices YoY%
2.60
3.04
Niittech
625
(5.2)
Nov14
China
Industrial Production (YoY)
6.60
6.20
More Events on Pg7
Videoind
14
(4.7)
As on November, 10 2017
Market Outlook
November 13, 2017
News Analysis
Axis Bank to Raise `11,625cr from Bain Capital, Others
Axis Bank Ltd. today approved raising `11,625.8cre by issuing shares and
warrants to Bain Capital Private Equity and other investors as the private lender
strengthens its capital base amid rising bad loans.
The capital raised will bolster the capital adequacy ratio (CAR), thereby providing
growth capital for the core business of the Bank and its subsidiaries. The CAR of
the bank stands at 16.32% as on Q2FY18.
The bank will issue shares at `525 apiece and warrants at `565. The fund raise,
after issuing new stock and conversion of warrants, will dilute its equity by 8.3%.
Warrants will be converted within 18 months, while shares will have a one-year
lock-in period, Axis Bank said in a statement to exchanges.
Economic and Political News
RBI remains net buyer of greenback in Sept, snap up $1.3 bn
Bankers meet to discuss NPA resolution, improving credit off take
GST rates of more goods may be re-jigged
Corporate News
ONGC expects first oil from KG basin in 2020 and gas by 2019
McLeod Russel to enter 50:50 stake joint venture with Greendale India
IPCA Labs wins order for supply of anti-malarial medicines
HSIL approves plan for de-merger of retail and building products business
Market Outlook
November 13, 2017
Quarterly Bloomberg Brokers Consensus Estimate
NTPC Ltd - Nov 13, 2017
Particulars ( ` cr)
2QFY18E
2QFY17
y-o-y (%)
1QFY18
q-o-q (%)
Sales
20,261
19,397
4.5
19,879
1.9
EBIDTA
5,482
5,391
1.9
5,040
8.8
%
27.1
27.8
25.4
PAT
2,481
2,495
(0.5)
2,618
(5.3)
IDEA Ltd - Nov 13, 2017
Particulars ( ` cr)
2QFY18E
2QFY17
y-o-y (%)
1QFY18
q-o-q (%)
Sales
7,619
9,225
(17.5)
8,054
(5.4)
EBIDTA
1,484
2,799
(46.9)
1,787
(16.9)
%
19.5
30.4
22.2
PAT
(1,079)
(42)
(2669)
(922)
(217)
Adani Ports Ltd - Nov 13, 2017
Particulars ( ` cr)
2QFY18E
2QFY17
y-o-y (%)
1QFY18
q-o-q (%)
Sales
2,532
1,301
94.6
1,805
40.2
EBIDTA
1,573
990
58.9
1,127
39.6
%
62.2
76.1
62.4
PAT
834
916
(8.9)
590
41.3
NMDC Ltd - Nov 13, 2017
Particulars ( ` cr)
2QFY18E
2QFY17
y-o-y (%)
1QFY18
q-o-q (%)
Sales
2,533
1,739
45.6
2,841
(10.8)
EBIDTA
1,243
825
50.7
1,494
(16.9)
%
49.1
47.5
52.3
PAT
852
770
10.7
969
(12.1)
Tata Chemicals Ltd - Nov 13, 2017
Particulars ( ` cr)
2QFY18E
2QFY17
y-o-y (%)
1QFY18
q-o-q (%)
Sales
3,824
3,390
12.9
2,572
48.6
EBIDTA
636
553
15.1
449
41.7
%
16.6
16.4
17.5
PAT
228
293
(22.1)
242
(5.8)
Apollo Hospitals Ltd - Nov 13, 2017
Particulars ( ` cr)
2QFY18E
2QFY17
y-o-y (%)
1QFY18
q-o-q (%)
Sales
1,874
1,634
14.7
1,684
11.3
EBIDTA
203
221
(8.1)
173
17.4
%
10.9
13.5
10.4
PAT
65
92
(29.4)
35
85.8
Market Outlook
November 13, 2017
Top Picks ★★★★★
Market Cap
CMP
Target
Upside
Company
Rationale
(` Cr)
(`)
(`)
(%)
Strong growth in domestic business due to its leade`hip
in acute therapeutic segment. Alkem expects to launch
Alkem Laboratories
23,243
1,944
2,125
9.3
more products in USA, which bodes for its international
business.
We expect the company would report strong profitability
Asian Granito
1,476
491
570
16.2
owing to better product mix, higher B2C sales and
amalgamation synergy.
Favorable outlook for the AC industry to augur well for
Cooling products business which is out pacing the
Blue Star
6,668
696
867
24.6
market growth. EMPPAC division's profitability to
improve once operating environment turns around.
With a focus on the low and medium income (LMI)
consumer segment, the company has increased its
Dewan Housing Finance
20,021
638
712
11.5
presence in tier-II & III cities where the growth
opportunity is immense.
Loan growth is likely to pick up after a sluggish FY17.
Lower credit cost will help in strong bottom-line growth.
Karur Vysya Bank
7,702
127
180
41.2
Increasing share of CASA will help in NIM
improvement.
High order book execution in EPC segment, rising B2C
KEI Industries
2,668
341
380
11.6
sales and higher exports to boost the revenues and
profitability
Expected to benefit from the lower capex requirement
Music Broadcast
2,140
375
434
15.7
and 15 year long radio broadcast licensing.
Massive capacity expansion along with rail advantage
Navkar Corporation
2,836
188
265
40.7
at ICD as well CFS augur well for the company
Strong brands and distribution network would boost
Siyaram Silk Mills
2,825
603
650
7.8
growth going ahead. Stock currently trades at an
inexpensive valuation.
Market leadership in Hindi news genre and no.
2
viewership ranking in English news genre, exit from the
TV Today Network
2,158
362
435
20.3
radio business, and anticipated growth in ad spends by
corporate to benefit the stock.
After GST, the company is expected to see higher
volumes along with improving product mix. The Gujarat
Maruti Suzuki
2,46,647
8,165
8,890
8.9
plant will also enable higher operating leverage which
will be margin accretive.
We expect loan book to grow at 24.3% over next two
GIC Housing
2,379
442
655
48.3
year; change in borrowing mix will help in NIM
improvement..
Source: Company, Angel Research
Market Outlook
November 13, 2017
Key Upcoming Events
Result Calendar
Date
Company
November 13, 2017
Tata Chemicals, BGR Energy , NMDC, GSPL, Goodyear, TVS Srichakra, Abbott India, MM Forging
November 14, 2017
Tata Global, JK Tyre, CEAT, Jyoti Structures, Bank of Baroda, Reliance Capital, Corporation Bank, MOIL
Source: Bloomberg, Angel Research
Global economic events release calendar
Bloomberg Data
Date
Time
Country
Event Description
Unit
Period
Last Reported
Estimated
Nov 13, 2017
India
Exports YoY%
% Change
Oct
25.67
India
Imports YoY%
% Change
Oct
18.09
Nov 14, 2017
3:30 PMEuro Zone Euro-Zone GDP s.a. (QoQ)
% Change
3Q P
0.60
0.60
12:00 PMIndia
Monthly Wholesale Prices YoY%
% Change
Oct
2.60
3.04
7:30 AMChina
Industrial Production (YoY)
% Change
Oct
6.60
6.20
3:00 PMUK
CPI (YoY)
% Change
Oct
3.00
3.20
US
Producer Price Index (mom)
% Change
Oct
0.80
12:30 PMGermany GDP nsa (YoY)
% Change
3Q P
0.80
2.00
Nov 15, 2017
3:00 PMUK
Jobless claims change
% Change
Oct
1.70
7:00 PMUS
Consumer price index (mom)
% Change
Oct
0.50
0.10
Nov 16, 2017
7:00 PMUS
Initial Jobless claims
Thousands
Nov 11
239.00
3:30 PMEuro Zone Euro-Zone CPI (YoY)
%
Oct F
1.40
1.40
7:45 PMUS
Industrial Production
%
Oct
0.28
0.40
Nov 17, 2017
7:00 PMUS
Housing Starts
Thousands
Oct
1,127.00
1,188.00
7:00 PMUS
Building permits
Thousands
Oct
1,225.00
1,242.00
Source: Bloomberg, Angel Research
Market Outlook
November 13, 2017
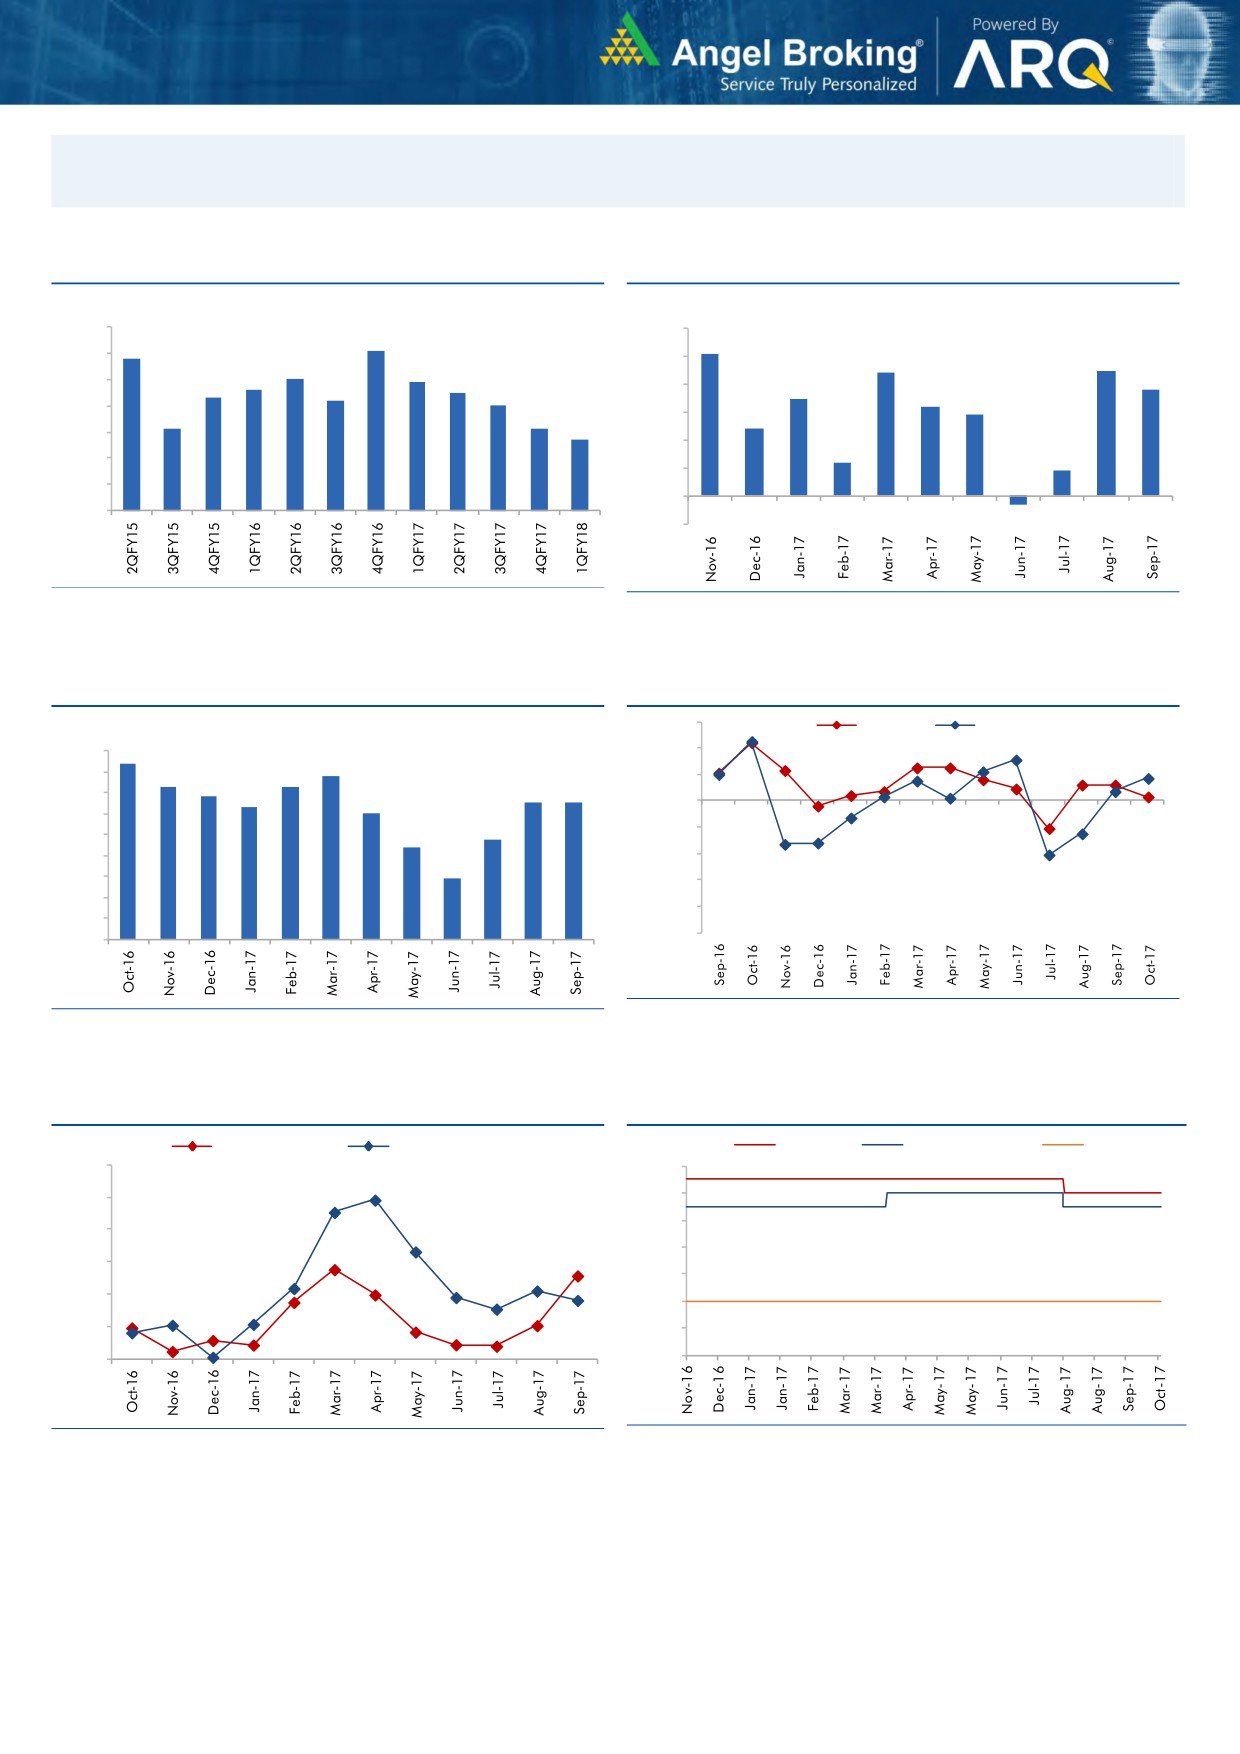
Macro watch
Exhibit 1: Quarterly GDP trends
Exhibit 2: IIP trends
(%)
(%)
10.0
6.0
9.1
5.1
8.8
9.0
5.0
4.4
4.5
8.0
7.9
7.6
7.5
3.8
8.0
7.3
7.2
4.0
3.5
7.0
3.2
2.9
7.0
6.1
6.1
3.0
2.4
5.7
6.0
2.0
1.2
5.0
0.9
1.0
4.0
-
3.0
(1.0)
(0.3)
Source: CSO, Angel Research
Source: MOSPI, Angel Research
Exhibit 3: Monthly CPI inflation trends
Exhibit 4: Manufacturing and services PMI
56.0
Mfg. PMI
Services PMI
(%)
4.5
4.2
54.0
3.9
4.0
3.6
3.7
52.0
3.4
3.2
3.3
3.3
3.5
3.0
50.0
3.0
2.4
48.0
2.5
2.2
2.0
46.0
1.5
1.5
44.0
1.0
42.0
0.5
40.0
-
Source: Market, Angel Research; Note: Level above 50 indicates expansion
Source: MOSPI, Angel Research
Exhibit 5: Exports and imports growth trends
Exhibit 6: Key policy rates
(%)
Exports yoy growth
Imports yoy growth
(%)
Repo rate
Reverse Repo rate
CRR
60.0
6.50
50.0
6.00
5.50
40.0
5.00
30.0
4.50
20.0
4.00
10.0
3.50
0.0
3.00
Source: Bloomberg, Angel Research
Source: RBI, Angel Research
Market Outlook
November 13, 2017
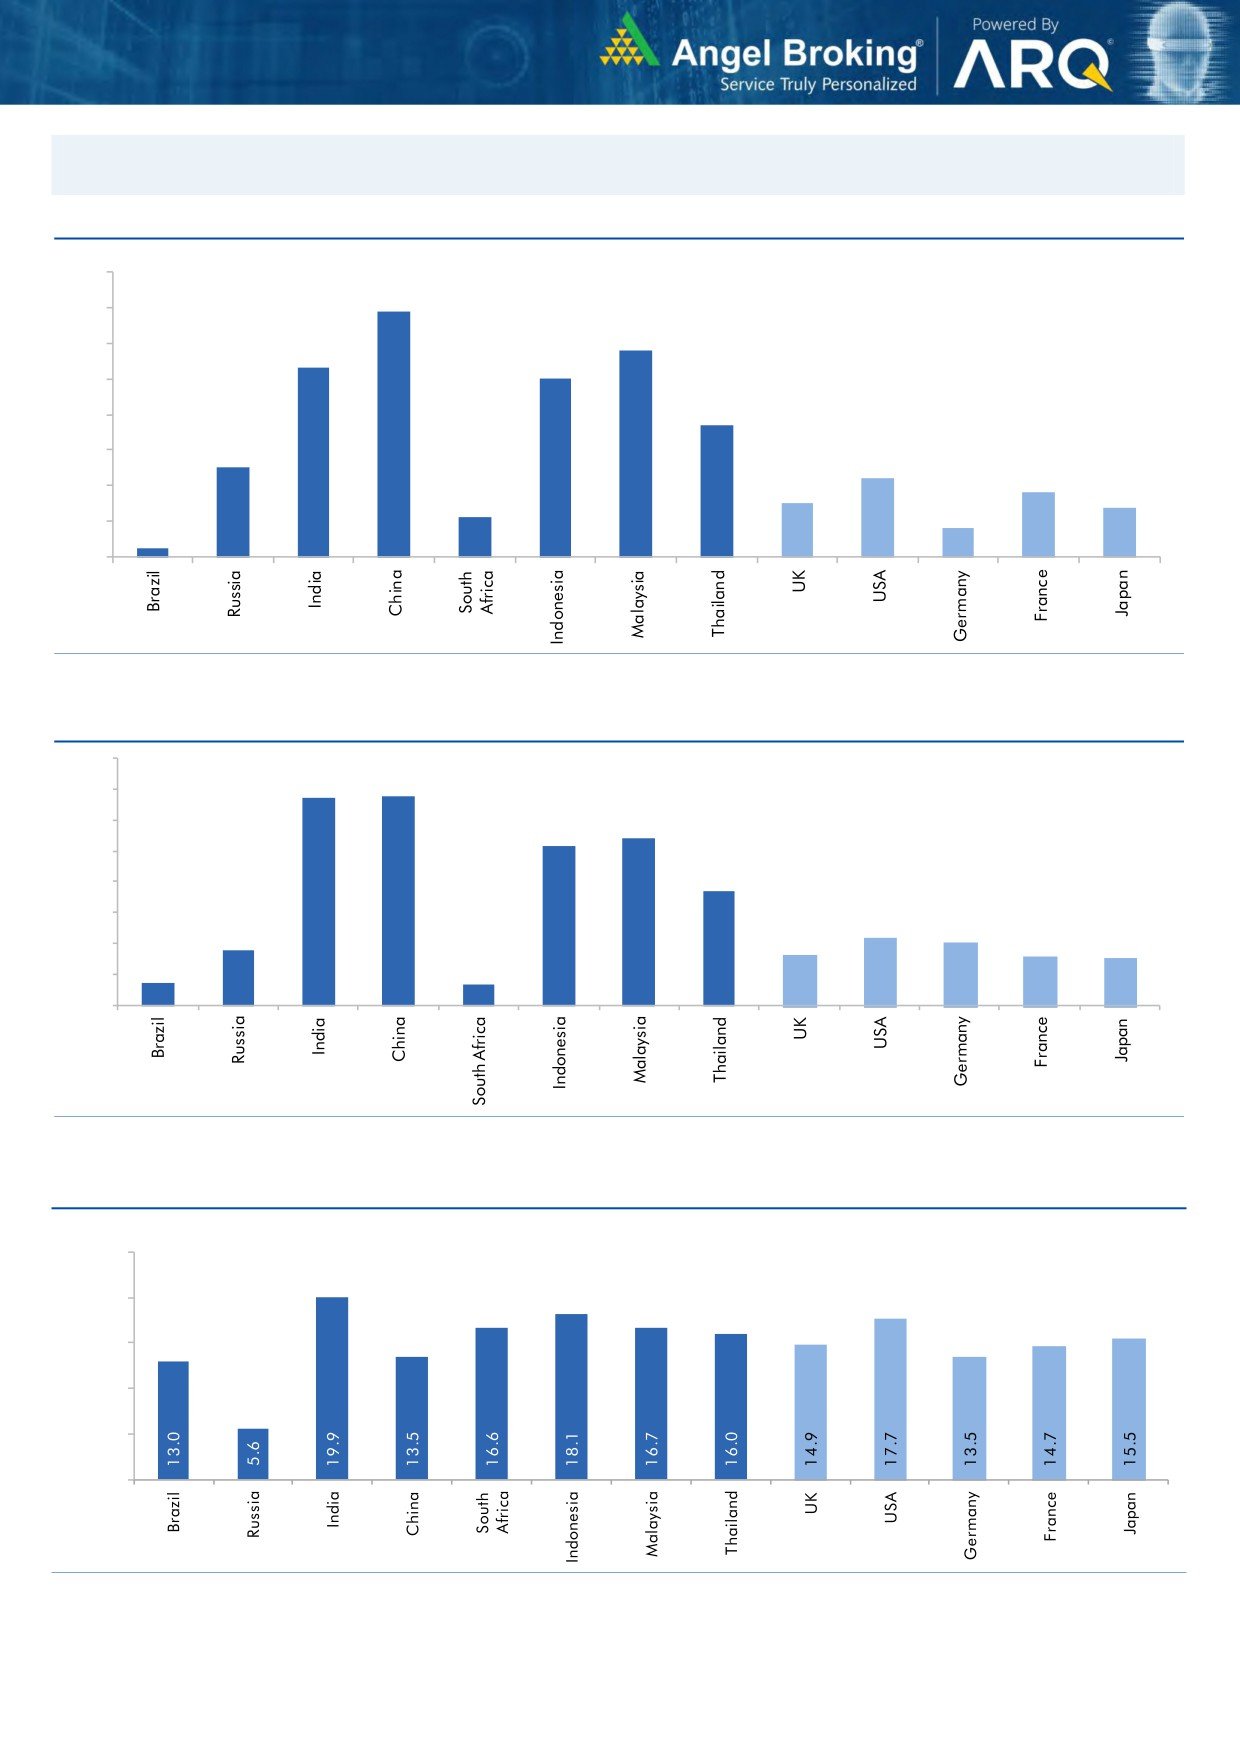
Global watch
Exhibit 1: Latest quarterly GDP Growth (%, yoy) across select developing and developed countries
(%)
8.0
6.9
7.0
5.8
6.0
5.3
5.0
5.0
1.1
3.7
4.0
2.5
3.0
2.2
1.8
2.0
1.5
1.4
0.8
1.0
0.3
-
Source: Bloomberg, Angel Research
Exhibit 2: 2017 GDP Growth projection by IMF (%, yoy) across select developing and developed countries
(%)
6.7
6.8
7.0
6.0
5.4
5.2
5.0
3.7
4.0
3.0
1.8
2.2
2.0
1.7
1.6
2.0
0.7
1.5
0.7
1.0
-
Source: IMF, Angel Research
Exhibit 3: One year forward P-E ratio across select developing and developed countries
(x)
25.0
20.0
15.0
10.0
5.0
-
Source: IMF, Angel Research
Market Outlook
November 13, 2017
Exhibit 4: Relative performance of indices across globe
Returns (%)
Country
Name of index
Closing price
1M
3M
1YR
Brazil
Bovespa
72,166
(4.7)
6.6
12.5
Russia
Micex
2,169
3.9
11.5
7.3
India
Nifty
10,322
3.0
3.4
20.8
China
Shanghai Composite
3,433
1.6
4.9
10.0
South Africa
Top 40
53,425
3.9
9.6
20.9
Mexico
Mexbol
48,028
(3.9)
(5.2)
6.0
Indonesia
LQ45
1,001
1.5
3.4
7.9
Malaysia
KLCI
1,742
(1.1)
(2.0)
5.0
Thailand
SET 50
1,073
(0.8)
7.0
14.4
USA
Dow Jones
23,422
2.4
7.2
24.3
UK
FTSE
7,433
(1.3)
1.7
10.1
Japan
Nikkei
22,681
8.9
13.4
34.2
Germany
DAX
13,127
1.4
9.3
22.3
France
CAC
5,381
0.3
5.1
19.5
Source: Bloomberg, Angel Research p68in4
Stock Watch
November 13, 2017
Company Name
Reco
CMP
Target
Mkt Cap
Sales ( Čcr )
OPM(%)
EPS (Č)
PER(x)
P/BV(x)
RoE(%)
EV/Sales(x)
(Č)
Price ( Č)
( Č cr )
FY18E FY19E
FY18E
FY19E
FY18E
FY19E
FY18E
FY19E
FY18E
FY19E
FY18E
FY19E
FY18E
FY19E
Agri / Agri Chemical
Rallis
Reduce
225
209
4,375
1,873
2,099
15.0
15.0
9.5
10.5
23.7
21.4
3.6
3.3
15.8
16.0
2.2
2.0
United Phosphorus
Accumulate
735
820
37,382
18,922
21,949
18.0
18.5
36.2
45.6
20.3
16.1
4.3
3.5
22.7
23.8
2.1
1.8
Auto & Auto Ancillary
Ashok Leyland
Accumulate
112
127
32,769
23,339
27,240
10.1
10.8
4.7
6.2
24.1
18.0
4.8
4.2
20.0
23.6
1.4
1.1
Bajaj Auto
Neutral
3,248
-
93,994
23,936
27,955
19.5
20.1
142.7
167.3
22.8
19.4
5.0
4.4
21.8
22.8
3.5
3.0
Bharat Forge
Buy
706
875
32,854
7,637
8,755
21.7
23.2
36.1
47.3
19.6
14.9
3.5
3.0
18.5
20.8
4.2
3.5
Eicher Motors
Neutral
30,552
-
83,169
19,043
22,837
19.5
19.9
835.4
1,019.0
36.6
30.0
13.7
10.5
40.9
37.8
4.2
3.5
Gabriel India
Neutral
196
-
2,810
1,782
2,033
9.7
10.2
7.1
8.9
27.6
22.1
5.6
4.7
21.0
22.2
1.5
1.3
Hero Motocorp
Accumulate
3,606
4,129
72,019
32,239
36,878
16.0
15.6
184.4
206.5
19.6
17.5
6.1
5.4
31.3
30.7
2.0
1.7
Jamna Auto Industries Neutral
60
-
2,391
1,441
1,662
14.4
14.8
13.9
17.6
4.3
3.4
1.2
1.0
30.0
31.0
1.7
1.4
Mahindra and Mahindra Neutral
1,393
-
86,543
46,971
53,816
13.6
14.0
67.7
79.8
20.6
17.5
2.9
2.6
15.0
15.9
1.7
1.5
Maruti
Accumulate
8,165
8,890
246,647
80,985
97,917
15.6
16.9
282.3
370.4
28.9
22.0
6.3
5.1
21.8
23.1
2.7
2.1
Minda Industries
Neutral
956
-
8,259
4,328
5,084
11.0
11.9
27.3
36.4
35.1
26.3
7.4
5.8
23.1
25.6
2.0
1.7
Motherson Sumi
Neutral
355
-
74,797
55,937
64,445
10.8
11.4
16.9
21.1
21.0
16.9
4.7
4.8
25.2
25.4
1.4
1.2
Tata Motors
Neutral
423
-
122,034
303,167
343,649
11.8
13.8
33.1
54.7
12.8
7.7
2.1
1.7
16.9
23.0
0.5
0.4
TVS Motor
Neutral
708
-
33,631
13,992
16,216
9.0
9.4
17.1
20.3
41.5
34.9
11.0
8.5
29.7
27.7
2.3
2.0
Amara Raja Batteries
Accumulate
751
858
12,831
6,140
7,122
14.3
15.6
29.3
39.0
25.6
19.3
4.4
3.7
17.1
19.0
2.1
1.8
Exide Industries
Neutral
201
-
17,081
8,689
9,854
15.1
15.2
9.7
11.0
20.8
18.3
3.7
3.3
15.7
16.1
1.7
1.5
Apollo Tyres
Neutral
235
-
11,972
15,739
17,326
13.3
14.6
20.4
26.7
11.5
8.8
1.4
1.2
20.4
26.7
1.0
0.9
Ceat
Neutral
1,739
-
7,032
6,661
7,717
11.1
14.2
116.2
178.2
15.0
9.8
2.6
2.2
15.2
21.3
1.2
1.0
JK Tyres
Neutral
150
-
3,391
8,318
9,239
16.2
16.4
21.0
27.5
7.1
5.4
1.4
1.1
19.1
20.4
0.9
0.7
Swaraj Engines
Neutral
1,915
-
2,379
788
889
16.4
16.5
71.6
81.0
26.8
23.7
7.7
7.2
29.6
31.0
2.7
2.3
Subros
Neutral
245
-
1,468
1,855
2,135
11.6
11.8
10.3
14.7
23.9
16.7
3.6
3.1
15.8
19.1
1.0
0.9
Capital Goods
BEML
Neutral
1,755
-
7,309
4,286
5,194
7.1
8.2
42.9
58.1
40.9
30.2
3.4
3.1
7.6
8.7
1.8
1.4
Bharat Electronics
Neutral
182
-
44,705
10,258
12,470
19.6
19.5
7.3
8.6
24.9
21.2
0.5
0.4
20.4
21.9
3.9
3.1
Voltas
Neutral
571
-
18,879
6,778
8,004
9.6
11.0
17.1
22.4
33.4
25.5
8.0
7.0
17.7
19.8
2.5
2.1
BHEL
Neutral
92
-
33,887
33,200
39,167
6.8
9.5
6.2
11.2
14.9
8.2
0.7
0.7
4.6
8.0
0.6
0.5
Blue Star
Buy
696
867
6,668
5,220
6,207
6.3
6.6
16.8
22.3
41.4
31.2
8.2
7.3
19.9
23.3
1.2
1.0
CG Power and Industrial
Neutral
84
-
5,249
6,555
7,292
7.5
7.5
-
0.8
8,375.0
104.7
1.3
1.3
0.1
1.2
0.9
0.8
Solutions
Greaves Cotton
Neutral
124
-
3,039
1,778
1,993
14.7
15.1
8.1
9.1
15.4
13.7
3.5
3.2
21.8
23.6
1.5
1.3
Stock Watch
November 13, 2017
Company Name
Reco
CMP
Target
Mkt Cap
Sales ( Čcr )
OPM(%)
EPS (Č)
PER(x)
P/BV(x)
RoE(%)
EV/Sales(x)
(Č)
Price ( Č)
( Č cr )
FY18E FY19E
FY18E
FY19E
FY18E
FY19E
FY18E
FY19E
FY18E
FY19E
FY18E
FY19E
FY18E
FY19E
Capital Goods
KEC International
Buy
304
350
7,818
9,779
11,113
9.4
9.8
14.2
18.2
21.4
16.7
4.1
3.4
21.1
22.1
1.1
0.9
KEI Industries
Accumulate
341
380
2,668
3,001
3,391
10.0
10.0
13.0
16.1
26.2
21.1
4.8
3.9
18.2
18.7
1.1
0.9
Thermax
Neutral
993
-
11,829
4,125
4,747
10.3
10.8
26.7
31.5
37.2
31.5
4.2
3.8
11.2
12.0
2.6
2.3
VATech Wabag
Buy
578
681
3,158
3,867
4,126
9.6
10.0
34.9
39.8
16.6
14.5
2.7
2.4
17.7
17.5
0.8
0.8
Cement
ACC
Neutral
1,754
-
32,938
12,255
13,350
13.5
14.3
58.0
66.2
30.2
26.5
3.6
3.3
11.5
12.2
2.7
2.4
Ambuja Cements
Neutral
269
-
53,503
10,250
11,450
17.5
19.0
7.2
8.3
37.4
32.5
2.7
2.5
7.0
7.8
5.0
4.4
India Cements
Neutral
171
-
5,262
6,135
6,750
14.8
15.2
8.5
11.5
20.1
14.9
1.0
0.9
4.8
6.2
1.2
1.0
JK Cement
Neutral
1,037
-
7,249
4,150
4,775
19.2
20.0
49.0
63.5
21.2
16.3
3.3
2.9
17.0
18.5
2.2
1.9
J K Lakshmi Cement
Neutral
443
-
5,212
3,422
3,757
15.5
17.0
13.5
23.2
32.8
19.1
3.4
2.9
10.8
15.5
1.9
1.7
Orient Cement
Neutral
167
-
3,415
2,215
3,233
16.8
17.0
5.9
6.9
28.3
24.2
2.2
2.0
10.8
10.1
2.5
1.7
UltraTech Cement
Neutral
4,446
-
122,054
28,250
35,150
20.2
23.5
77.5
122.2
57.4
36.4
4.8
4.4
9.6
14.8
4.8
3.8
Construction
KNR Constructions
Neutral
263
-
3,693
1,846
2,203
14.5
14.5
12.1
13.7
21.7
19.2
1.2
1.0
17.5
16.7
2.1
1.7
Larsen & Toubro
Neutral
1,264
-
177,036
95,787
109,476
10.2
11.6
44.5
50.8
28.4
24.9
3.6
3.3
12.9
13.1
2.4
2.1
Gujarat Pipavav Port
Neutral
134
-
6,488
739
842
61.6
62.7
5.1
6.2
26.3
21.8
3.3
3.2
12.7
14.9
8.2
7.1
PNC Infratech
Neutral
184
-
4,722
2,040
2,935
13.0
13.0
6.4
9.0
28.8
20.5
0.8
0.7
9.7
12.2
2.3
1.7
Simplex Infra
Neutral
513
-
2,539
6,012
6,619
11.6
11.7
21.1
31.0
24.4
16.6
1.7
1.6
6.5
8.6
1.0
0.9
Sadbhav Engineering
Neutral
316
-
5,424
3,823
4,426
10.7
10.8
10.3
11.8
30.7
26.8
3.7
3.2
10.1
10.5
1.7
1.5
NBCC
Neutral
275
-
24,714
9,099
12,706
6.4
6.4
7.3
9.6
37.7
28.7
1.7
1.3
27.5
30.5
2.6
1.9
MEP Infra
Neutral
111
-
1,804
2,403
2,910
18.3
16.8
2.4
6.1
47.2
18.3
17.9
12.1
35.2
55.8
1.9
1.6
SIPL
Neutral
123
-
4,322
2,060
2,390
46.8
47.7
(5.8)
(3.1)
4.6
5.2
(14.2)
(2.3)
6.9
6.4
Engineers India
Neutral
189
-
12,719
1,795
2,611
21.1
22.4
5.9
8.1
32.0
23.3
2.3
2.2
12.9
16.1
5.5
3.6
Financials
Axis Bank
Accumulate
545
580
130,575
32,558
35,843
3.5
3.2
27.8
41.0
19.6
13.3
2.1
1.9
11.4
14.9
-
-
Bank of Baroda
Neutral
170
-
39,067
22,533
26,079
2.4
2.4
12.0
20.9
14.1
8.1
0.9
0.9
6.6
11.0
-
-
Canara Bank
Neutral
389
-
23,232
17,925
20,235
2.0
2.1
18.5
36.5
21.0
10.7
0.8
0.8
3.4
6.2
-
-
Can Fin Homes
Neutral
462
-
6,155
586
741
3.5
3.5
107.8
141.0
4.3
3.3
0.9
0.8
24.1
25.6
-
-
Cholamandalam Inv. &
Neutral
1,270
-
19,849
2,826
3,307
6.3
6.3
53.7
64.6
23.7
19.7
4.0
3.4
18.3
18.9
-
-
Fin. Co.
Dewan Housing Finance Accumulate
638
712
20,021
2,676
3,383
2.4
2.7
37.4
49.7
17.1
12.9
2.2
2.0
13.8
16.2
-
-
Equitas Holdings
Buy
140
235
4,753
1,125
1,380
9.6
9.8
1.5
6.0
93.3
23.3
2.1
2.0
2.4
8.2
-
-
Federal Bank
Accumulate
112
125
21,986
4,896
5,930
2.8
3.1
5.4
7.6
20.9
14.8
1.8
1.6
8.5
11.0
-
-
Stock Watch
November 13, 2017
Company Name
Reco
CMP
Target
Mkt Cap
Sales ( Čcr )
OPM(%)
EPS (Č)
PER(x)
P/BV(x)
RoE(%)
EV/Sales(x)
(Č)
Price ( Č)
( Č cr )
FY18E FY19E
FY18E
FY19E
FY18E
FY19E
FY18E
FY19E
FY18E
FY19E
FY18E
FY19E
FY18E
FY19E
Financials
GIC Housing
Buy
442
655
2,379
376
477
3.6
3.7
33.0
40.0
13.4
11.0
2.4
2.0
20.0
23.0
-
-
HDFC Bank
Neutral
1,819
-
470,455
55,236
63,253
4.5
4.4
68.9
82.4
26.4
22.1
4.6
3.8
18.7
18.5
-
-
ICICI Bank
Neutral
319
-
204,471
42,361
51,378
3.6
3.9
18.4
25.7
17.3
12.4
1.9
1.8
11.3
15.0
-
-
Karur Vysya Bank
Buy
127
180
7,702
3,289
3,630
3.7
3.9
10.8
14.1
11.8
9.1
1.4
1.3
12.5
14.7
-
-
LIC Housing Finance
Accumulate
587
630
29,636
4,895
6,332
3.4
3.7
50.7
66.8
11.6
8.8
2.3
1.9
21.7
23.8
-
-
Punjab Natl.Bank
Neutral
190
-
40,442
23,708
25,758
2.1
2.1
5.9
16.4
32.3
11.6
1.0
0.9
3.0
8.3
-
-
RBL Bank
Neutral
510
-
21,204
2,309
2,888
2.6
2.5
16.4
19.1
31.1
26.7
3.9
3.5
13.3
13.8
-
-
Repco Home Finance
Buy
587
825
3,670
496
597
4.4
4.2
38.5
48.7
15.3
12.0
2.7
2.3
19.6
20.6
-
-
South Ind.Bank
Neutral
31
-
5,530
3,195
3,567
3.0
3.1
3.0
3.8
10.2
8.0
1.0
0.9
10.5
11.9
-
-
St Bk of India
Neutral
333
-
287,620
105,827
121,056
2.4
2.5
16.1
25.6
20.7
13.0
1.6
1.5
6.6
9.9
-
-
Union Bank
Neutral
167
-
12,128
14,650
16,225
2.3
2.3
23.1
32.5
7.2
5.1
0.6
0.5
7.1
9.2
-
-
Yes Bank
Neutral
304
-
69,626
11,088
13,138
3.0
2.9
84.0
99.3
3.6
3.1
0.6
0.5
16.3
16.8
-
-
FMCG
Akzo Nobel India
Neutral
1,781
-
8,542
3,164
3,607
13.8
13.7
58.6
67.9
30.4
26.2
7.5
6.6
24.5
25.1
2.6
2.2
Asian Paints
Neutral
1,176
-
112,845
17,603
20,615
18.6
18.6
2,128.9
2,543.3
0.6
0.5
11.7
9.8
28.0
28.9
6.2
5.2
Britannia
Neutral
4,873
-
58,503
9,690
11,278
14.8
15.4
84.0
101.0
58.0
48.3
21.1
16.8
40.6
39.0
6.0
5.2
Colgate
Neutral
1,039
-
28,250
4,420
5,074
24.9
25.3
28.6
32.8
36.3
31.7
14.3
11.6
43.8
40.5
6.1
5.3
Dabur India
Neutral
342
-
60,218
8,346
9,344
19.6
19.9
7.8
9.0
43.8
38.0
8.8
8.0
25.2
24.8
6.8
6.0
GlaxoSmith Con*
Neutral
6,049
-
25,438
5,072
5,760
18.2
18.4
176.3
199.2
34.3
30.4
7.3
6.6
21.2
21.7
4.3
3.8
Godrej Consumer
Neutral
961
-
65,496
10,171
11,682
20.8
21.5
21.7
27.1
44.3
35.5
10.0
8.6
22.3
23.4
6.6
5.7
HUL
Neutral
1,291
-
279,380
37,077
41,508
20.3
21.8
5,189.9
6,318.5
0.3
0.2
39.4
33.6
74.8
82.0
7.4
6.6
ITC
Neutral
261
-
318,468
44,588
49,853
37.0
37.3
9.6
11.0
27.2
23.8
6.7
6.4
25.1
27.3
6.6
5.9
Marico
Neutral
311
-
40,149
6,788
7,766
18.5
19.2
7.1
8.5
43.8
36.6
15.3
13.1
36.9
38.0
5.8
5.0
Nestle*
Neutral
7,770
-
74,916
10,083
11,182
20.0
20.9
119.7
141.3
64.9
55.0
228.8
209.1
36.7
39.8
7.1
6.4
Tata Global
Neutral
236
-
14,904
7,121
7,641
11.9
12.3
6.9
8.0
34.2
29.5
2.3
2.2
6.8
7.2
1.9
1.7
Procter & Gamble
Neutral
8,801
-
28,569
3,034
3,579
27.1
27.7
167.7
198.8
52.5
44.3
14.1
12.1
28.8
29.5
8.8
7.4
Hygiene
IT
HCL Tech^
Buy
868
1,014
123,834
50,009
54,608
22.1
22.1
62.8
67.6
13.8
12.8
3.1
2.7
22.4
20.6
2.1
1.8
Infosys
Buy
961
1,120
220,649
70,333
75,960
26.0
26.0
61.7
65.9
15.6
14.6
3.0
2.7
18.9
18.7
2.5
2.3
TCS
Neutral
2,703
-
517,489
123,384
134,488
26.1
26.1
133.2
143.7
20.3
18.8
5.6
5.2
27.6
27.8
3.9
3.5
Tech Mahindra
Accumulate
490
533
47,862
31,015
33,496
15.0
15.0
35.6
38.1
13.8
12.9
2.3
2.2
17.0
16.3
1.3
1.1
Stock Watch
November 13, 2017
Company Name
Reco
CMP
Target
Mkt Cap
Sales ( Čcr )
OPM(%)
EPS (Č)
PER(x)
P/BV(x)
RoE(%)
EV/Sales(x)
(Č)
Price ( Č)
( Č cr )
FY18E FY19E
FY18E
FY19E
FY18E
FY19E
FY18E
FY19E
FY18E
FY19E
FY18E
FY19E
FY18E
FY19E
IT
Wipro
Neutral
302
-
146,998
54,164
56,544
22.3
22.3
18.8
19.5
16.1
15.5
2.6
2.2
15.0
13.6
1.9
1.7
Media
D B Corp
Neutral
367
-
6,745
2,404
2,625
30.5
31.5
23.7
26.9
15.5
13.6
3.6
3.1
23.5
22.8
2.6
2.4
HT Media
Neutral
100
-
2,316
2,589
2,830
15.1
15.4
8.3
10.9
12.0
9.1
1.0
0.9
8.4
10.4
0.4
0.3
Jagran Prakashan
Buy
172
225
5,615
2,541
2,835
28.5
28.7
12.7
14.1
13.5
12.2
2.8
2.4
21.3
21.4
2.1
1.8
Sun TV Network
Neutral
872
-
34,368
3,238
3,789
51.9
55.1
30.9
38.0
28.2
23.0
8.1
7.1
30.0
31.0
10.1
8.5
Hindustan Media
Neutral
236
-
1,732
1,002
1,074
23.3
23.5
29.2
33.8
8.1
7.0
1.3
1.1
15.6
15.4
0.7
0.5
Ventures
TV Today Network
Buy
362
435
2,158
667
727
27.7
27.7
18.6
20.1
19.5
18.0
3.0
3.1
15.6
17.3
2.8
2.6
Music Broadcast Limited Buy
375
434
2,140
271
317
91.0
109.0
6.0
10.0
62.5
37.5
3.9
3.5
6.5
9.3
7.5
6.2
Metals & Mining
Coal India
Neutral
285
-
176,694
82,301
91,235
17.0
18.0
17.1
20.5
16.7
13.9
3.1
2.9
45.0
55.0
1.8
1.6
Hind. Zinc
Neutral
313
-
132,231
22,108
24,555
57.0
58.0
22.1
26.3
14.2
11.9
4.6
3.7
32.0
35.0
5.0
4.2
Hindalco
Neutral
264
-
59,328
102,350
105,355
13.5
14.5
21.5
24.5
12.3
10.8
1.7
1.4
15.0
15.2
1.2
1.1
JSW Steel
Neutral
269
-
65,035
64,500
68,245
21.1
21.5
20.1
21.2
13.4
12.7
2.5
2.1
-
-
1.7
1.7
NMDC
Neutral
126
-
39,881
10,209
11,450
47.0
48.0
11.1
12.1
11.4
10.4
1.6
1.5
-
-
3.4
3.1
SAIL
Neutral
81
-
33,495
54,100
63,555
3.0
10.0
(10.0)
1.5
54.1
1.1
1.1
-
-
1.6
1.4
Vedanta
Neutral
324
-
120,381
81,206
87,345
28.0
29.0
26.5
33.5
12.2
9.7
2.8
2.4
-
-
2.2
1.9
Tata Steel
Neutral
701
-
68,126
121,445
126,500
16.2
17.2
65.4
81.3
10.7
8.6
1.7
1.5
-
-
1.1
1.0
Oil & Gas
GAIL
Neutral
457
-
77,309
53,115
52,344
14.2
15.3
30.0
31.1
15.2
14.7
1.9
1.8
-
-
1.2
1.2
ONGC
Neutral
191
-
244,858
83,111
84,934
44.2
44.9
16.4
16.9
11.6
11.3
1.4
1.3
-
-
2.8
2.8
Indian Oil Corp
Neutral
394
-
191,493
396,116
432,560
8.5
8.8
40.1
42.2
9.8
9.3
1.7
1.5
-
-
0.6
0.6
Reliance Industries
Neutral
884
-
574,611
257,711
267,438
17.0
18.2
89.1
89.5
9.9
9.9
0.9
0.9
-
-
1.9
1.8
Pharmaceuticals
Alembic Pharma
Buy
511
600
9,635
3,903
4,584
18.2
19.2
21.8
27.2
23.4
18.8
4.3
3.6
19.8
20.6
2.5
2.1
Alkem Laboratories Ltd
Accumulate
1,944
2,125
23,243
6,320
7,341
17.5
19.8
72.7
96.6
26.7
20.1
4.7
4.0
16.7
18.7
3.6
3.0
Aurobindo Pharma
Accumulate
740
823
43,370
17,086
19,478
22.1
22.0
44.7
51.4
16.6
14.4
3.7
3.0
24.7
22.7
2.6
2.3
Aventis*
Neutral
4,468
-
10,291
2,508
2,862
16.8
16.8
139.9
153.8
31.9
29.1
4.6
3.8
23.5
25.8
3.7
3.1
Cadila Healthcare
Reduce
465
426
47,630
11,584
13,228
20.3
20.4
18.7
21.3
24.9
21.8
5.6
4.5
24.6
22.9
3.9
3.4
Cipla
Sell
609
458
49,010
16,619
19,437
15.4
16.2
19.7
24.3
30.9
25.1
3.5
3.1
12.0
13.2
3.1
2.6
Dr Reddy's
Neutral
2,346
-
38,909
15,844
17,973
17.6
18.2
91.7
111.0
25.6
21.1
2.9
2.6
11.9
13.0
2.7
2.4
GSK Pharma*
Neutral
2,631
-
22,287
3,260
3,651
15.0
18.0
46.1
58.6
57.1
44.9
11.7
12.1
20.0
26.5
6.7
6.1
Indoco Remedies
Sell
258
153
2,379
1,154
1,310
14.9
14.9
11.3
12.7
22.9
20.3
3.2
2.9
15.0
15.0
2.2
1.9
Stock Watch
November 13, 2017
Company Name
Reco
CMP
Target
Mkt Cap
Sales ( Čcr )
OPM(%)
EPS (Č)
PER(x)
P/BV(x)
RoE(%)
EV/Sales(x)
(Č)
Price ( Č)
( Č cr )
FY18E FY19E
FY18E
FY19E
FY18E
FY19E
FY18E
FY19E
FY18E
FY19E
FY18E
FY19E
FY18E
FY19E
Pharmaceuticals
Ipca labs
Neutral
581
-
7,335
3,593
4,022
14.5
15.5
19.4
25.2
30.0
23.1
2.7
2.5
9.5
11.2
2.1
1.9
Lupin
Buy
834
1,467
37,678
18,657
21,289
21.3
23.3
52.8
66.7
15.8
12.5
2.4
2.0
16.3
17.5
2.0
1.7
Natco Pharma
Buy
917
1,057
15,981
1,886
2,016
32.3
29.5
23.2
22.0
39.6
41.6
8.3
7.3
20.9
17.6
8.3
7.8
Sun Pharma
Accumulate
527
558
126,512
32,899
36,451
26.9
25.4
31.6
32.3
16.7
16.3
2.9
2.6
18.7
18.8
3.5
3.0
Syngene International
Accumulate
499
556
9,986
1,394
1,818
33.0
36.0
15.8
20.6
31.6
24.2
5.9
4.8
18.6
20.0
7.1
5.5
Power
Tata Power
Neutral
83
-
22,436
32,547
33,806
20.5
20.5
4.7
5.4
17.7
15.5
1.7
1.5
10.5
10.5
1.7
1.6
NTPC
Neutral
177
-
145,656
86,070
101,246
28.3
30.7
12.9
16.2
13.7
10.9
1.4
1.3
10.6
12.4
3.1
2.7
Power Grid
Accumulate
211
223
110,491
29,183
32,946
89.7
90.0
18.0
20.8
11.8
10.2
2.0
1.7
17.7
18.2
7.7
7.2
Real Estate
Prestige Estate
Neutral
286
-
10,742
4,607
5,146
21.0
22.2
7.9
9.8
36.3
29.2
2.2
2.1
10.3
12.0
3.5
3.2
MLIFE
Buy
436
522
2,236
487
590
12.3
17.8
21.0
31.2
20.7
14.0
1.1
1.0
5.2
7.4
3.3
2.7
Telecom
Bharti Airtel
Neutral
502
-
200,590
97,903
105,233
36.0
36.3
9.3
11.1
54.0
45.4
2.6
2.5
5.0
5.6
3.0
2.7
Idea Cellular
Neutral
97
-
35,009
35,012
37,689
27.1
27.7
(4.4)
(2.7)
1.5
1.6
(6.8)
(4.6)
2.3
2.1
zOthers
Abbott India
Neutral
4,501
-
9,565
3,244
3,723
14.9
16.1
167.5
209.4
26.9
21.5
5.9
5.0
23.7
24.8
2.6
2.2
Asian Granito
Buy
491
570
1,476
1,169
1,286
12.5
12.5
16.0
19.7
30.7
24.9
3.3
2.9
10.7
11.6
1.5
1.3
Bajaj Electricals
Neutral
407
-
4,142
4,646
5,301
6.7
7.6
16.1
22.3
25.3
18.3
4.1
3.5
16.4
19.2
0.9
0.8
Banco Products (India)
Neutral
219
-
1,566
1,530
1,695
13.2
12.7
19.0
20.0
11.5
11.0
1.8
1.6
0.2
0.2
0.9
103.7
Coffee Day Enterprises
Neutral
228
-
4,695
3,494
3,913
17.4
18.0
4.8
5.7
-
40.0
2.0
1.9
-
0.1
1.8
1.6
Ltd
Elecon Engineering
Neutral
73
-
816
171
201
15.0
16.2
36.0
43.0
2.0
1.7
0.2
0.2
0.1
0.1
4.1
3.5
Garware Wall Ropes
Neutral
900
-
1,969
928
1,003
15.2
15.2
39.4
43.2
22.8
20.9
3.8
3.2
16.5
15.4
2.0
1.8
Goodyear India*
Neutral
802
-
1,851
1,717
1,866
11.8
12.3
47.9
49.8
16.7
16.1
2.6
2.2
15.6
15.7
0.8
110.6
Hitachi
Neutral
2,410
-
6,553
2,355
2,715
10.3
10.8
49.0
60.9
49.2
39.6
11.5
9.1
0.2
0.2
2.8
2.4
HSIL
Neutral
477
-
3,449
2,240
2,670
14.6
15.0
17.0
22.0
28.1
21.7
2.3
2.2
0.1
0.1
1.8
1.4
Interglobe Aviation
Neutral
1,182
-
42,746
22,570
27,955
14.2
15.0
63.6
81.8
18.6
14.5
9.8
8.3
0.5
0.6
1.6
1.2
Jyothy Laboratories
Neutral
344
-
6,253
1,781
2,044
14.1
15.0
9.4
10.5
36.8
32.8
7.8
7.4
0.2
0.2
3.7
3.2
Linc Pen & Plastics
Neutral
248
-
367
420
462
9.3
9.3
15.3
17.1
16.2
14.5
2.7
2.8
16.9
19.5
0.9
0.8
M M Forgings
Neutral
830
-
1,002
542
642
20.1
21.0
41.6
56.8
20.0
14.6
2.8
2.3
0.1
0.2
2.3
2.0
Mirza International
Neutral
160
-
1,926
1,148
1,285
18.0
18.0
8.0
9.4
19.9
17.1
3.3
2.8
16.3
16.1
1.8
1.6
Navkar Corporation
Buy
188
265
2,836
561
617
41.5
41.5
11.5
12.7
16.4
14.8
1.7
1.5
10.5
10.4
5.7
5.0
Nilkamal
Neutral
1,599
-
2,387
2,317
2,525
11.4
11.1
96.0
105.0
16.7
15.2
2.8
2.5
0.2
0.2
1.0
0.9
Stock Watch
November 13, 2017
Company Name
Reco
CMP
Target Mkt Cap
Sales ( Čcr )
OPM(%)
EPS (Č)
PER(x)
P/BV(x)
RoE(%)
EV/Sales(x)
(Č)
Price ( Č)
( Č cr )
FY18E FY19E FY18E FY19E FY18E FY19E FY18E FY19E FY18E FY19E FY18E FY19E FY18E FY19E
zOthers
Parag Milk Foods
Neutral
249
-
2,098
1,987
2,379
7.6
9.0
12.4
18.3
20.1
13.6
2.8
2.5
8.2
13.2
1.2
1.0
Radico Khaitan
Neutral
210
-
2,802
1,811
1,992
13.2
13.2
8.1
8.8
26.0
23.9
2.6
2.9
10.1
12.0
1.9
1.7
Relaxo Footwears
Neutral
569
-
6,836
1,981
2,310
13.7
14.5
12.0
15.5
47.4
36.7
9.2
7.5
0.2
0.2
3.5
3.0
Siyaram Silk Mills
Accumulate
603
650
2,825
1,769
1,981
12.7
12.7
22.6
26.2
26.6
23.0
4.1
3.6
15.5
15.5
1.8
1.6
Styrolution ABS India* Neutral
960
-
1,688
1,800
1,980
8.0
8.1
42.0
46.2
22.9
20.8
2.6
2.3
0.1
0.1
1.1
1.0
Surya Roshni
Neutral
370
-
1,622
4,870
5,320
7.7
7.8
22.8
28.1
16.3
13.2
2.2
1.9
0.1
0.1
0.6
0.5
TVS Srichakra
Neutral
3,058
-
2,342
2,729
2,893
12.7
12.5
248.5
265.0
12.3
11.5
3.5
2.8
0.3
0.3
0.9
0.8
Visaka Industries
Neutral
682
-
1,082
1,104
1,214
12.1
12.6
31.0
37.9
22.0
18.0
2.7
2.4
0.1
0.1
1.2
1.1
VIP Industries
Neutral
306
-
4,324
1,450
1,693
10.4
10.5
6.5
7.8
46.8
39.2
9.9
8.6
21.1
22.1
3.0
2.5
Navin Fluorine
Neutral
698
-
3,440
945
1,154
22.4
22.6
28.7
34.8
24.3
20.1
4.0
3.4
-
-
3.2
2.5
Source: Company, Angel Research; Note: *December year end; #September year end; &October year end; Price as on November 10, 2017
Market Outlook
November 13, 2017
Research Team Tel: 022 - 39357800
DISCLAIMER
Angel Broking Private Limited (hereinafter referred to as “Angel”) is a registered Member of National Stock Exchange of India
Limited,Bombay Stock Exchange Limited and Metropolitan Stock Exchange Limited. It is also registered as a Depository Participant with
CDSL and Portfolio Manager with SEBI. It also has registration with AMFI as a Mutual Fund Distributor. Angel Broking Private Limited is a
registered entity with SEBI for Research Analyst in terms of SEBI (Research Analyst) Regulations, 2014 vide registration number
INH000000164. Angel or its associates has not been debarred/ suspended by SEBI or any other regulatory authority for accessing
/dealing in securities Market. Angel or its associates/analyst has not received any compensation / managed or
co-managed public offering of securities of the company covered by Analyst during the past twelve months.
This document is solely for the personal information of the recipient, and must not be singularly used as the basis of any investment
decision. Nothing in this document should be construed as investment or financial advice. Each recipient of this document should make
such investigations as they deem necessary to arrive at an independent evaluation of an investment in the securities of the companies
referred to in this document (including the merits and risks involved), and should consult their own advisors to determine the merits and
risks of such an investment.
Reports based on technical and derivative analysis center on studying charts of a stock's price movement, outstanding positions and
trading volume, as opposed to focusing on a company's fundamentals and, as such, may not match with a report on a company's
fundamentals. Investors are advised to refer the Fundamental and Technical Research Reports available on our website to evaluate the
contrary view, if any.
The information in this document has been printed on the basis of publicly available information, internal data and other reliable
sources believed to be true, but we do not represent that it is accurate or complete and it should not be relied on as such, as this
document is for general guidance only. Angel Broking Pvt. Limited or any of its affiliates/ group companies shall not be in any way
responsible for any loss or damage that may arise to any person from any inadvertent error in the information contained in this report.
Angel Broking Pvt. Limited has not independently verified all the information contained within this document. Accordingly, we cannot
testify, nor make any representation or warranty, express or implied, to the accuracy, contents or data contained within this document.
While Angel Broking Pvt. Limited endeavors to update on a reasonable basis the information discussed in this material, there may be
regulatory, compliance, or other reasons that prevent us from doing so.
This document is being supplied to you solely for your information, and its contents, information or data may not be reproduced,
redistributed or passed on, directly or indirectly.
Neither Angel Broking Pvt. Limited, nor its directors, employees or affiliates shall be liable for any loss or damage that may arise from
or in connection with the use of this information.